FIVB · sustainability of sporting events
Planet Positive Sport
The platform an international volleyball federation uses to measure, review and certify the environmental footprint of its events, from the first supplier email to a published report.
0
Accounts a supplier has to open
5
Roles, committee through to expert
5
Languages, Japanese and Thai among them
282
Lines of JavaScript in the browser
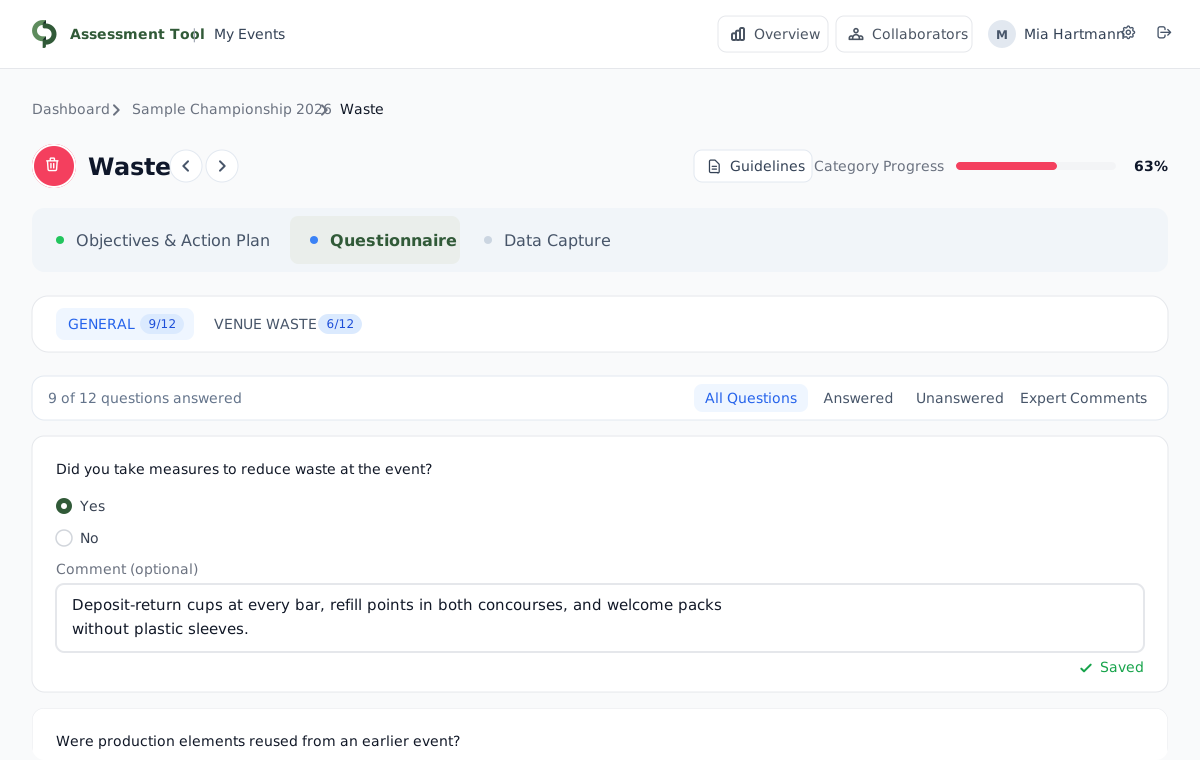
The data belongs to people who will never sign up
Working out the footprint of a major sporting event is a coordination problem long before it is an environmental one. The venue knows its energy use, the hotels know their room nights, the caterer knows the meal split, and the freight and mobility partners know the rest. Somebody has to collect all of it, and that somebody is usually a volunteer doing it around a full-time job.
The trap is that any collection which starts with a signup form collects nothing. A hotel will not create an account to tell you its room nights. So suppliers here never make one: they get a link by email that opens a form already filled in with the event's details and whatever was saved last time, in their own language. What they send goes to a federation administrator, who approves it, edits and approves it, or sends it back with a reason.
- A supplier form arrives by link, pre-filled, with no account and no password anywhere in the flow
- Approved figures are the only ones that reach the footprint
- The committee works category by category, with one progress figure that means the same thing on every screen
- Colleagues can be invited onto an event to fill in the parts they know
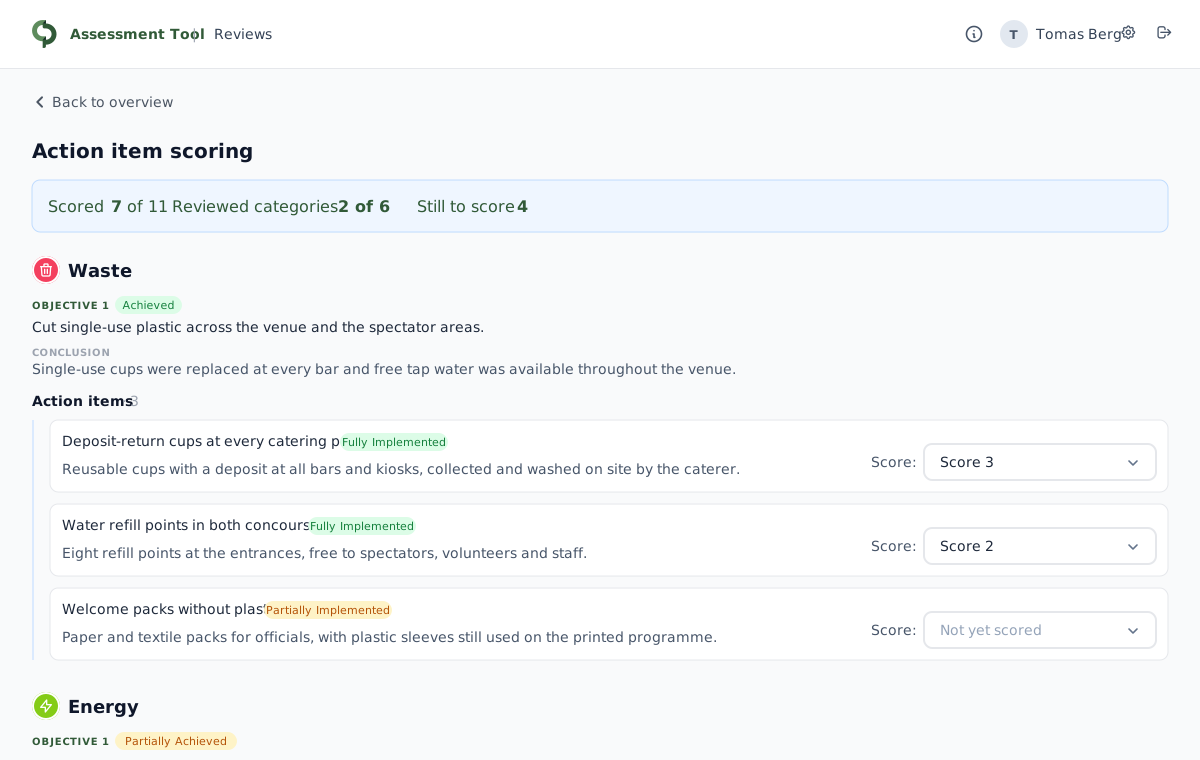
An expert signs it off, one category at a time
When every category is complete the committee submits the event. The federation assigns an independent expert, who opens the same questionnaire with editing switched off and works through it: recommendations that do not block, comments that do, and a score for every action item against a written scale.
Sign-off happens category by category, and final confirmation is gated on all of them being signed with nothing blocking left open. Only then does the platform build the report, as a web page and as a PDF carrying one certified score. That file is rendered once and archived, so the page a reader sees and the download an administrator takes are the same object rather than two renders that might differ.
- The expert reads exactly the screens the committee filled in, and cannot change them
- Three kinds of feedback: recommendations, blocking comments, and per-category sign-off
- Comments return to the committee, who answer them in place
- The published page and the downloaded PDF are one archived file, not two renders
A hundredth of a point decides certification
The threshold that qualifies an event sits at 2.61, which makes this a system where rounding is not a detail. Intermediate rounding at three steps of the chain was moving real events across that line, so the maths now rounds once, at the very end.
Stopping it happening again needed more than a fix. Every constant and every rounding step in the methodology is hashed into a named fingerprint that a test checks on every run: change a weight or a threshold without declaring a new version and the build fails, naming the value that moved and what it moved from. When the methodology was replaced in July, a script re-scored every live event under both the old formula and the new one and listed exactly which events crossed the threshold, and that list went to the client before the change shipped.
- One rounding step, at the end, because three intermediate ones moved events across the line
- A methodology fingerprint test that fails on an undeclared change and names the value
- Every live event re-scored under both formulas before a methodology change ships
- An emission-factor chain without a real carbon factor cannot be published at all
One platform, several federations, almost no JavaScript
The same installation serves more than one federation. Each gets its own subdomain, provisioned when it is created, its own logo, colours and partner marks, and its own questionnaire, which an administrator builds through a tree editor without writing anything. Deploying an edited questionnaire over live data is the dangerous move, so before anything applies, the platform walks the live tree against the draft and reports every question that would be deleted and every one whose answer type changed.
All of it is rendered on the server. The entire client side is 282 lines of hand-written JavaScript, with no framework, no bundled chart library and no icon package. The radar, donut and bar charts on the dashboards are drawn as SVG by the same server code that renders the page, label wrapping included.
- Per-federation subdomain, branding and questionnaire, on one installation
- A pre-flight before any questionnaire deploy, naming what would be deleted or reinterpreted
- Charts drawn server-side as SVG, so no charting library ships to the browser
- Five languages shipped, with plural rules correct in each
Related projects

JT Vault
Financial management and business operations platform for digital agencies
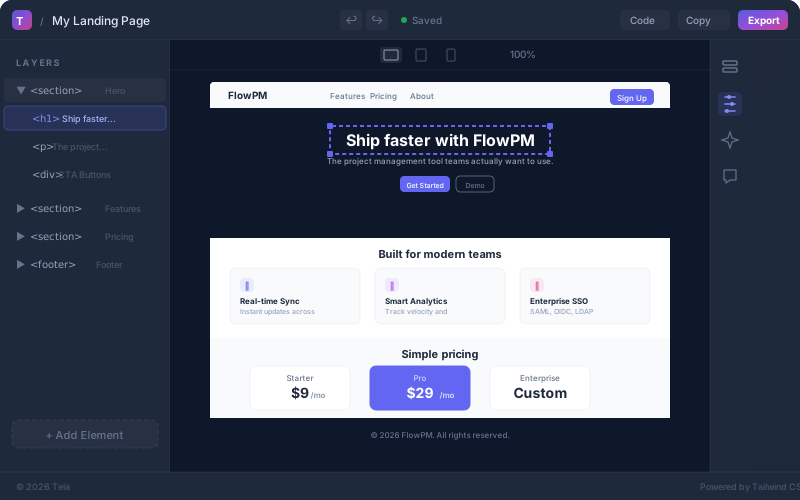
Tela
AI design system that turns natural language into production-ready HTML

JT i18n
Self-hosted translation management system for multi-format, multi-locale apps
Want something like this?
Tell us what you need and we build a working prototype first, so you see it before you pay for it.